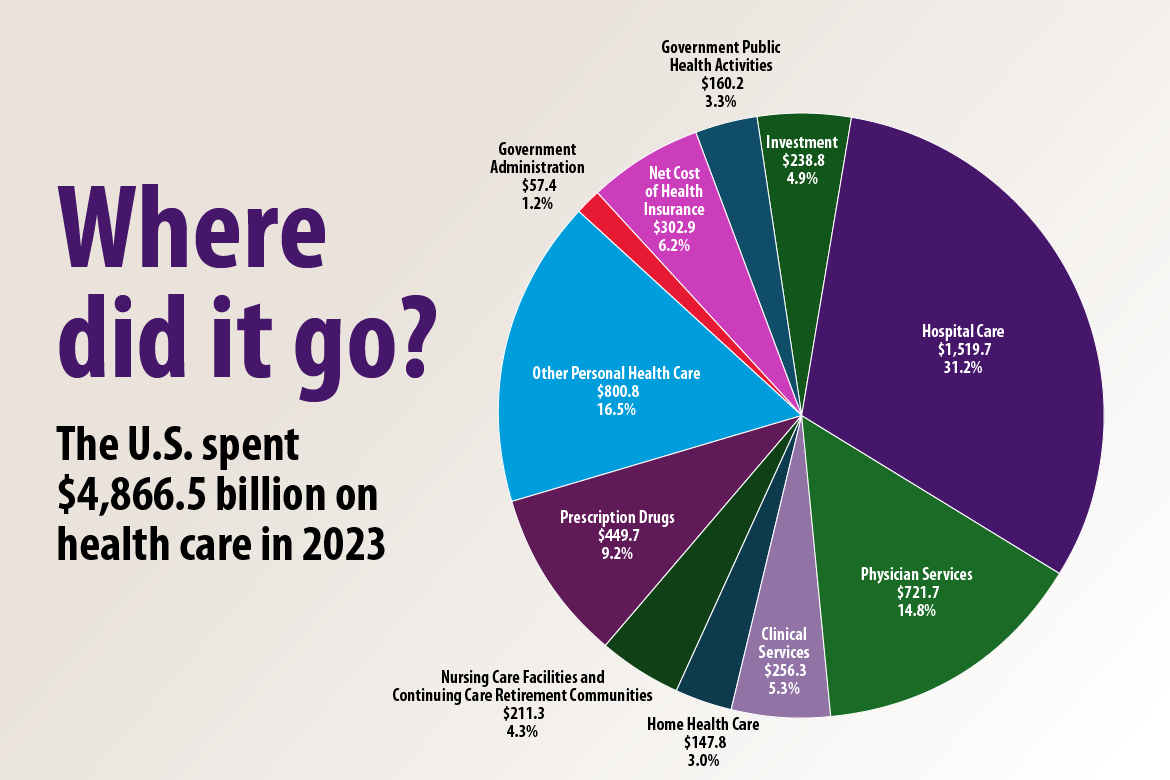
Health spending in the U.S. increased by 7.5% in 2023 to $4.9 trillion or $14,570 per capita. This growth rate is significantly higher than the 4.6% rise in 2022, and apart from the 10.4% rise in 2020 due to the COVID-19 pandemic, it is the highest growth rate observed since 2003 (8.5%). After the pandemic, health care spending decelerated in 2021 and 2022, with overall trends more closely resembling pre-pandemic trends. The acceleration in 2023 was driven by higher utilization of health care goods and services as well as a historically high 92.5% insured share*. For the first time since the pandemic, the growth in health care spending (7.5%) outpaced GDP growth (6.6%).
Overall, health spending was 17.6% of GDP in 2023, similar to pre-pandemic shares (17.5% in 2019) after an uptick in 2020 (19.5%) and 2021 (18.3%).
Policy research perspective
A new AMA Policy Research Perspective provides an in-depth look at U.S. health spending in 2023.
Health care spending explained
The United States spent $4,866.5 billion on health care in 2023.
This spending can be broken down into the following categories:
- Hospital care
- Physician services
- Clinical services
- Prescription drugs
- Nursing care facilities
- Home health care
- Other personal health care costs
- Government administration: includes all administrative costs associated with insuring individuals in health insurance programs
- Net cost of health insurance: The difference between what insurers incur in premiums and the amount paid in benefits. This includes administrative costs, additions to reserves, rate credits and dividends, premium taxes and fees, and net underwriting gains or losses
- Government public health activities
- Investment spending
Hospital services and physician services are two of the largest categories of health spending. From 2014 to 2023, both saw an average annual growth rate of 5.3%. In comparison, prescription drugs and clinical services experienced average annual growth rates of 5.7% and 6.6%.
In 2023, personal health care spending saw the largest annual growth since 1990, with an overall increase of 9.4%. Notably, spending on prescription drugs and hospital care rose by 11.4% and 10.4%. Spending on physician services and clinical services increased by 7.6% and 7.0%. Each of these growth rates were considerably larger than in 2022.
The report discusses this breakdown in further detail and also assesses spending by source of funds (i.e., private health insurance, Medicare, Medicaid, etc.) and sponsors (i.e., federal government, households, private businesses, etc.).
*Martin, A. B., Hartman, M., Washington, B., Catlin, A., & National Health Expenditure Accounts Team. (2025). National Health Expenditures In 2023: Faster Growth As Insurance Coverage And Utilization Increased: Article examines National Health Expenditures in 2023. Health Affairs, 44(1), 12-22.
Previous policy research perspectives
- Policy Research Perspectives: National Health Expenditures, 2022: A Return to Pre-Pandemic Growth Rates As Spending on Physician Services Decelerates (PDF)
- Policy Research Perspectives: National Health Expenditures, 2021: Decline in pandemic-related government spending results in 8-percentage point decrease in total spending growth (PDF)
- Policy Research Perspectives: National Health Expenditures, 2020: Spending accelerates due to spike in federal government expenditures related to the COVID-19 pandemic (PDF)
- Policy Research Perspectives: National Health Expenditures, 2019: Steady spending growth despite increases in personal health care expenditures in advance of the pandemic (PDF)
- Policy research perspectives: National Health Expenditures, 2018: Spending growth remains steady even with increases in private health insurance and Medicare spending (PDF)
- Policy research perspectives: National health expenditures, 2017: The slowdown in spending growth continues (PDF)
- Policy research perspectives: National health expenditures, 2016: Annual spending growth on the downswing (PDF)
- Policy research perspectives: National health expenditures, 2015: Annual spending growth at its highest rate since 2007 (PDF)
- Policy research perspectives: National health expenditures, 2014: Spending grows by more than 5% for first time since 2007 (PDF)
- Policy research perspectives: National health expenditures, 2013: Another year, another record low for growth (PDF)
- Policy research perspectives: What's behind the recent spending slowdown? An overview of literature that tries to explain it (PDF)
- Policy research perspectives: Perspectives on the recent slowdown In health spending growth (PDF)
- Policy research perspectives: National health expenditures, 2010: slow growth continues (PDF)
- Policy research perspectives: National health expenditures: What do they measure? What’s new about them? What are the trends? (PDF)


