Health Equity

Prioritizing Equity video series: Research and data for health equity

. 42 MIN READ

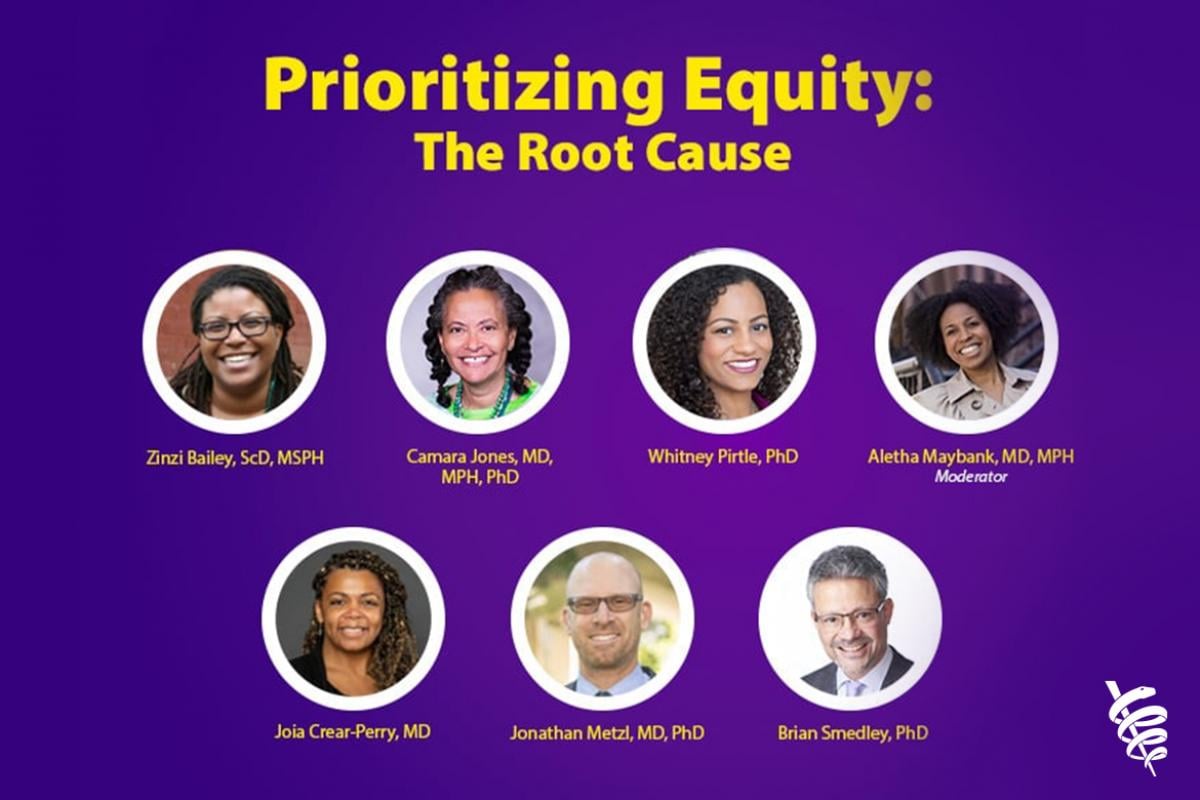
In the Nov. 19, 2020 Prioritizing Equity panel, leaders in public health and academia have the conversation about the power of data in understanding health inequities and the systemic issues that cause them to persist.


  • Nancy Krieger, PhD, professor of social epidemiology in the Department of Social and Behavioral Science at Harvard T.H. Chan School of Public Health
  • Maureen Benjamins, PhD, senior research fellow at the Sinai Urban Health Institute; Twitter: @mobenjamins13
  • Alyasah Ali Sewell, PhD, associate professor of sociology at Emory University and founder and director of The Race and Policing Project; Twitter: @aasewell

Moderator

  • Fernando De Maio, PhD, director, research and data use, AMA Center for Health Equity; Twitter: @fernandodemaio

Research and Data for Health Equity

Earn credit while watching an episode of Prioritizing Equity, the AMA series amplifying voices in the health equity space. 

Nov. 19, 2020

De Maio: Hi. Good afternoon. I'm Fernando De Maio, director of research and data use at the Center for Health Equity at the American Medical Association and a professor of sociology at De Paul University.

It's a pleasure to be with you today and to host this inspiring conversation about the power of data in the context of health equity. I think all of us are committed to doing work that doesn't just describe the problems in the world but contributes to their alleviation, recognizing health inequities as avoidable, unnecessary, unfair, and unjust. I want to thank you all for tuning in today and indeed thank our panelists for joining us and to the AMA indeed for hosting this conversation.

Also want to give you a reminder to visit our health equity resource center for COVID-19 on the AMA website and also to download a copy of our new AMA Center for Health Equity Latinx COVID-19 report which is now available. The report illuminates the inequities facing the Latinx community and provides valuable insight for physicians, health professionals and others working to serve the community in a more equitable manner.

Last week, Dr. Maybank hosted a great post-election conversation on centering equity in health policy 2020 and beyond, which is now up on our YouTube channel in case you missed it. But today we have this remarkable panel of health equity researchers to speak with us about the power of data in the context of health equity. My panel really needs no introduction, but I will introduce us for everyone who doesn't know us.

First Professor Nancy Krieger, PhD, professor of social epidemiology in the Department of Social and Behavioral Science at Harvard T.H. Chan School of Public Health. Hello, Professor Krieger. Maureen Benjamins, PhD, senior research fellow at the Sinai Urban Health Institute here in Chicago, and Ali Sewell, PhD, associate professor of sociology at Emory University and founder and director of The Race and Policing Project. Welcome to the conversation today.

So, we'll begin as we usually do. Professor Krieger, I'd like to ask you where you are physically and how you are doing.

Dr. Krieger: So, I am based in Boston, Massachusetts and I recognize that I am on indigenous land and I pay heed to critical indigenous thinking in my work accordingly. I am doing okay on a chilly day in Boston. A bit of winter seems to have snuck in, in the midst of warmer days.

De Maio: Ali, where are you and how are you?

Dr. Sewell: I'm doing well. I'm in Atlanta, Georgia. It's getting a little cold here as well. I'm in the southwest side of Atlanta and holding up the barrier.

De Maio: Excellent. Excellent. And Maureen.

Dr. Benjamins: Hi. Thanks for having me. I'm in Downers Grove, Illinois, just outside of Chicago. I'm doing pretty well. For a change it's warm here.

De Maio: Okay. Yeah, yeah. We had some cold weather last week and I'm sure it's going to come back.

So, Professor Krieger, we'll begin with you. In many ways, you've helped to define the field of social epidemiology, charting for a course for the critical analysis of health inequities. This is well documented in your book, "Epidemiology and the People's Health," which has a very prized position in my bookshelf behind me. You've influenced health equity researchers across the country, particularly through your work with the American Public Health Association. Could you tell us about that work in the context of where we find ourselves now with COVID-19 and also the work you've done with the Spirit of 1848 Caucus, which has been so inspiring at the level of understanding the social and political contexts of health equity data.

Dr. Krieger: So first, thanks very much for including me on this panel. I'm delighted to be with all the co-presenters and to have this conversation today. I'll answer very quickly a little bit about the data and health justice, but then also speak to specifically what the Spirit of 1848 Caucus is and the American Public Health Association.

I want to say that that's a big question you ask, but that when you think about data, it's really important to understand there is always a two-edged sword. One edge is the "no data, no problem" issue which means when you have denial and suppression of data, typically by those in power because they do not want the problems visible so they cannot be held accountable, so that's one side. But the other side is "bad data, big problem" because you can have the case when data gets used badly, often to entrench injustice. The point for those of us in public health who care about health equity is to have the data that we need to fight for health justice and we have to recognize the tensions that exist about the data that we use, how they are conceptualized, by whom, who is in control of their content, and who is in control of their use. These are really critical and for COVID-19, all three issues play out.

For example, on the "no data, no problem" bucket of things, there has been many people know profound lack of decent data on race ethnicity for the COVID cases and the deaths, despite the fact that race ethnicity is a variable that's been included on death certificates since we've had death certificates in this country. There's also been consistently a lack of socioeconomic data, even though, again, on the death certificate you will find education data, you will find the zip code. You could easily link to zip code characteristics, et cetera, et cetera. So, there's been real problems with data because it ends up being purely racialized if it's even there at all and it doesn't allow for giving good context and it's been taking other people to add those kinds of bits of data and to change what the interpretation is.

For the "bad data, big problems" similarly, and this ties to I think the ways in CDC data have been consistently distorted during the course of this pandemic, there were the initial attempts when they were showing what the proportion of cases were by race ethnicity in relation to very strange, weighted populations. Working with several doctoral students who took the lead on this at school, we showed that were real problems because their initial data seemed to suggest that white people were at greater risk and what happened was they were weighting denominators of COVID cases. They were weighting denominators in relation to the populations in the counties that were hardest hit and basically ended up treating racial segregation as a nuisance variable which is not a good idea. It's fairly fundamental to who lives where, under what conditions, what kinds of jobs they have, what that means for work, and what that means above all for risk of having COVID.

So they've now, in response to criticism, they've now changed it and they initially were putting up weighted and total population counts so you could get a better sense of was their disproportion, although again, the reliance on counts as opposed to doing what epidemiologists normally do which is compute rates, was highly disturbing. Now they've even gotten rid of that and they just have some very obscure language about the composition has something to do effectively with either the racial ethnic composition of where places are that people have COVID plus also the different risks by race ethnicity. Unless you're a trained data analyst or a Talmudic scholar, you are not going to understand what they are saying at the website. It's problematic. It ends up being that you can't tell what's going on and that's not good. There are other websites which do make things much more clear. AAP and others. There are others that have taken the work the COVID Racial Tracker has been doing innovative and important work since early on and that's, again, a link between journalists and health researchers not the preeminent health institution in our country.

Cont. Dr. Krieger: Finally for efforts for health justice for data, you're seeing community groups, you're seeing progressive health departments and many others trying to figure out what are the right community metrics to understand who needs testing, to understand what jobs are at risk, to start to say that you actually have to have link contact tracing to understand workplace outbreaks, that you have to understand the conditions in which people live, not simply tell people to wash their hands and wear a mask but to understand what the constraints are. If they're working in jobs where that's difficult, where they're not supplied with adequate PPE, and also if people are living in crowded housing. Well, crowded housing doesn't just happen. It happens in part because there's a lack of affordable housing and there's a lack of a living wage and what does that mean if who's living in the crowded housing and what that means about inter-generational transmission.

So, I think that there's many ways that the data have been used in a contextualized way and in a way that is historicized that helps people understand what the structural forces are that are affecting things and therefore what needs to be considered from an equity perspective. To say that there's a not simple answer. Data, in Latin, comes from the verb dare, to give. It's the past participle. It means that which is given, except data are never given. Data are conceived by people. They are gathered with purpose in mind. We don't get to make them up, not unless you're a very bad scientist. But we are testing in the public domain knowledge, ideas, and claims about that knowledge. That testing is crucial in terms of understanding what's more than just personal opinion or epiphany.

From that standpoint we do need to understand the tensions and complexities of data. There's a long history in this country of scientific racism. There's a long history of opposing that scientific racism. Both have used data. So, the key point is data never, ever, ever speak for themselves and you have to ask, "Who's making them, for what purpose" to understand what and what is left out. It's never just what's there, it's almost what's missing.

On that note, with regard to the Spirit of 1848 Caucus of the American Public Health Association, we founded it in 1994 and it's always had three foci. One is the social history of public health because it helps to know something about where we come from and the we in that is everybody in public health whether community activist, whether medical professionals, whether public health scientists, whomever. The politics of public health data, which is the point of today's presentation, and then also progressive pedagogy. Who teaches who what about what, of our history, of our methods, of our ideas, of the actual substantive knowledge.

And with regard to the politics of public health data, we have from the start been very concerned with the metrics for analyzing and monitoring health inequities. We started with our very first panels in the late 1990's, looking at how do you measure racial discrimination at multiple levels? How do you measure social class? We also, at the very beginning, brought in senior leadership from the Office of Management and Budget when they're in the middle of trying to figure out what became ultimately the 1997 OMG Federal Classifications on Race Ethnicity, and we convened two sessions, actually, back to back that brought together all the caucuses of color and other progressive caucuses to talk with the OMB representatives and it was their first chance to engage with public health people to get a sense of how we thought about things in relation to race ethnicity and what that might mean for these regulations that affect the very categories that are used by the census, that are used by any federal agency, that are used in the National Health Interview survey, you name it. So that was something that was a very important way of engaging and understanding that these data come about through discussion, debate and dialogue.

Most recently, this past year at APHA, our data session focused on algorithmic bias. How is that playing out in public health data, in medical institution data? What do researchers and people that are using these data need to be aware of? How does it not only affect treatment people get but also allocation of resources and funding and decisions that are made on a cost basis. Then I organized an integrative session that was focused on an issue that is still too much under the radar screen, which is what's going to be the impact of differential privacy starting with 2020 decennial census, and I won't go into a whole screed about that. I could say a lot but the point is, is that there's a clear question about what are the tradeoffs on protecting privacy, which is important especially given possibilities of linkage of census data to all kinds of third party vendor data and lots of other stuff, versus what do you need to have accurate data excluding at smaller levels of geography accurate to get good denominators to understand who the population is and to also that will affect allocation of resources.

So these are things that people who are very trained in using census data need to understand and this is the kind of training that people like us have in using data is really critical and it was great to engage with staff from the Census Bureau about this and to have a range of people, including some more sociologists, who could be talking whether about American Indian data, whether about looking at health inequities across other racial ethnic groups at different levels of geography, and to get us geared for what's going to be ten years plus with this decennial census, separate from questions of under count which are a whole other complication.

It means, in summary, we need to be incredibly technically sophisticated in understanding the fundamental population data that we use that is there to guide questions and can lead to distortion of the answers if we don't understand the ways those data come about and why.

De Maio: Thank you. Many of the ideas you present resonate with the ideas that I first encountered as a graduate student in the U.K. at the University of Essex where I came across a group called Radical Statistics, charged with not just describing but overcoming injustices and recognizing that the politics of data, creation, dissemination and analysis.

Dr. Sewell, I want to ask you about something that you have on your website where you describe yourself as a storyteller, noting that your stories are driven by questions whose answers carve out a path to freedom. You note that the greatest challenge you face is painting stories with numbers. Can you tell us about this approach to research, which I find so inspiring, particularly in the context of health equity?

Dr. Sewell: Well, thank you for doing the deep dive. You say things, and you're like, "No one's ever going to read that." Honestly, what I can say is I started off in this role as an engineer. All I wanted to do was play with Lego blocks and build. I had these ideas of what would it be like to build a building that didn't need a surface, right? How do you hang something in the air? You do that too many times and you start to realize there's something fantastical about thinking, which is how do you get from here to there? If you really live on land, how do you actually get there? So, there's where the story comes, right, so how do you get to the place of flying?

Flying for me means being able to create the kind of world you want and get the kind of resources you need. I'll give a concrete example. I do a lot of data stuff and I would say the unique part of my data is linking context to where you are, to who you are. When I look out into the world, I never see a person. When I see someone talking, I never see the interaction. I think, "Okay, they're in a building," right? "That building is on a corner. That corner is in a neighborhood." In some of the work I do, I think about the block. I don't think about the block as a set of object on the block. I think about a woman who needs to go to the doctor's office. That doctor's office is about ten blocks away. What does she experience on the way to the doctor's office? I can tell you it's the stop sign. I can tell you it's the crosswalk, and that's important.

I could also tell you that on five out of ten of those blocks, there's someone getting a pat down. This is actually kind of normal. If in the sixth block, she also experienced that same pat down, by the time that she actually gets to the doctor's office, the likelihood of her getting on the weight scale and saying, "How much do you weigh today," she's actually going to indicate that she's obese. When the doctor says, "Well, we want to understand what's influencing you being here saying that you're short of breath?" Well, they also have diabetes. She actually also says high blood pressure.

So, when I think about why data matters and what to make sense of the different point estimates, I really do think about the point estimates in our CSV files at the very bottom of it. I think about what does it take for that woman to get to the doctor's office and if she gets to the doctor's office, what happens to that doctor when they see those numbers? They never see that sixth block. All they see is her body, they see the diagnoses, they see the prescriptions that she's taking. They don't see the fact that on that sixth block, there was something there that actually influences the fact that her body is going to deteriorate across time. I want to be able to explain that and create models for that rather than to tell me, "What's her attitudes," or what kind of health insurance she has. You're not your health insurance. You're the one on one, walks down the street, getting in the car, getting out of things, and that is when I think about modeling things, that is the first thing I think about, is the person and the way they use their space.

De Maio: Fantastic. And that's a very sociological way of looking at data, right, as the embodiment of the personal troubles of that person, but also the public issues in which their lives play out.

Dr. Benjamins, Maureen, I want to ask you about the great work that you've done at SUHI, at the Sinai Urban Health Institute. SUHI is well known for its work with data, particularly with hyper-local data here in Chicago. Can you tell us about the origins of the Sinai Survey, which has been so impactful across the city, and particularly your approach for ensuring meaningful community engagement in the collection and interpretation of the data? How can researchers get genuine community engagement, authentic engagement, at different stages of the research process? What's been your experience?

Dr. Benjamins: Yeah, thank you. So, where I'm at, at the Sinai Urban Health Institute, it's a fairly unique research center. It's the research arm of the largest private safety net healthcare system in Illinois, so a unique place. Sinai's been around for over a hundred years, but the research center was founded 20 years ago with the specific mission of documenting and addressing health disparities in Chicago. That's our mission and as part of that, we implemented the Sinai Community Health Survey. We've done it twice. We did it about a decade ago because there just wasn't enough local health data. There was city level data, but as we all know, particularly in a segregated city like Chicago, the city averages are just covering these patterns among different groups and different neighborhoods, so we wanted local neighborhood level data. There was also not enough data on social risk factors.

We think of health holistically, so we needed questions on things not, just like the previous speaker said, not just the diagnosis or not just the insurance status, but other social factors. The most recent Sinai Survey has over 450 questions, so just a huge battery of questions. We updated this data in 2016 to respond to calls from our community partners because they needed updated data. It helps them search for funding and target their services.

Our research center is dedicated to doing community-informed work, so for the surveys, we engaged the community by having a community advisory committee which thankfully a lot of people do know for research studies. It wasn't as common 20 years ago, but it is now. So, 20 years ago we had our community advisory committee and what was unique is that we gave them a lot of power. We had representative from all the communities that we surveyed and they had the power to add any questions they wanted to the survey, they could veto any of the questions that we proposed, they could change any of the wording. This is problematic to a lot of researchers and other institutions. It doesn't work this way. You could wipe out somebody's whole research agenda because they said no to certain questions. They also did change a lot of wording because they felt it was inaccessible or that it might not get the right answer to their question, so we gave up using validated measures in some cases because our community members felt strongly about that.

We use them in developing the survey. We use them in all points in the whole process. So, they helped us develop recruiting materials. They helped us train interviewers from the community. They were very helpful when the data came back to help us interpret the data. What did those findings mean, what resonated with them, what was the priority issues, and then they helped us disseminate? So, we prioritized our dissemination not to a peer reviewed audience but to communities. So, we held community forums in libraries. They advised us to use things like infographics to get the information out. Our community profiles were done through videos instead of a booklet that would be available online or on somebody's shelf. We really allowed them to direct all of our work and we showed that we really valued their input and we valued their wisdom and their lived experience and that we know that they knew their communities better than we did. That was the process that we used for our surveys.

De Maio: It really is a remarkable story, and I remember always being very impressed that the community advisory board vetoed the inclusion of social capital measures, which were very popular at the time, and I can understand many researchers wanting to utilize. The community said, "We didn't want this asked in this way at this time," and you went with their decision and I was always very impressed by that because it entails a remarkable sharing of power over the research process and it should be that way. It should be community driven and community engaged, so I was always impressed by Sinai's approach.

De Maio: Looking at it a little bit closer, a particular way of looking at data, Professor Krieger, a notable branch of your work in recent years has revolved around the index of concentration at the extremes, an innovative way for measuring racialized economic segregation, and really the distribution of other things but notably racialized economic segregation. Can you tell us about the measure and the hopes you have for it as a practical measure for public health departments or possibly even health systems?

Dr. Krieger: Sure. I mean, the Index for the Concentration of Extremes was developed by Douglas Massey in 2001 and he is eminent for his studies on American apartheid and racial segregation in this country. He was looking for a measure that could be used at multiple geographic levels. I came across it because I was trying to understand why there were not any good measures of racialized economic segregation, that in this country there's always a discussion of either "race" or "class" but how do you put these together and that you also can't simply use two such measures simultaneously often in one model because of not complete but partial co-linearity. So were there any measures out there, and I was very surprised that there were and also because I've done work for a long time on what are area based measures that people can use to append to individual health records, whether from a health agency or hospital or wherever to understand something about the context in which people live, and again I see these as contextual measures, never as proxy measures and never as purely "ecologic measures" which is a misuse of the term in any event.

When Massey developed the ICE measure, as it's called, and I grant you ICE is not a great acronym in this day and age, that it was mainly used in the social sciences up to when I started using it in a study beginning in 2014 and it was only used in relation to economic measures, so it was used only in relation to income and education, for example. So what we did, starting with the study that I was looking at actually air pollution, black carbon exposure, in the greater Boston area and both the distribution of the exposure and then also ultimately in relation to high blood pressure, was to start playing around with it and to realize that actually you could make this measure so that you could apply to use it to race, ethnicity and you could also apply it to create a measure of racialized economic segregation.

What that measure does, basically with the ICE does, is a very simple, straightforward measure. You have to classify people into two extremes of the distribution. So, it could be high income and low income, it could be a descreen of the distribution in terms of racial privilege, white non-Hispanic for example versus Black. Then you say, "How many people are in the most privileged category?" You subtract from that the number of people in the least privileged category and you divide by the total number of people, or it could be households. So, what that means is if you have a value of 1 for the area that everybody is in the most privileged category. If you have a value of -1, everyone is in the least privileged category and if you have a value in between it's because there are some people that are in between. It gives you a sense of the amount of spatial social polarization.

So what I realized that what you could is you could also create extremes which we have done where you put, for example, as the extreme of privilege white non-Hispanic high income households and then you put as the other extreme either Black low income households or people of color low income households or depending again where you're doing it, you can do Latinx low income households. I mean, it depends what your research question is. You could also do other kinds of measures. You could, for example, look at the number of people who self-identify as being cisgender, heterosexual on one hand and some version of sexual and gender minority as the other in terms of looking at, again, different kinds of privilege. It's completely possible to construct it in different ways once you get past the idea that you can only use something like income or education as the variables at play.

So we've used this and we've used it in multiple levels of geography and an advantage of the ICE is that you can use it at the census block group, you can use it at the track, you can use it at the city, county level, zip code level because it allows you to look within that unit of geography. For a lot of the work that was done previously on racial discrimination and segregation in particular, they used something called the Index of Dissimilarity, which basically says within this bigger unit, how many people would have to move around within smaller units to get a more even distribution? So typically, it's computed at the city level using census tract as a smaller unit. But to assign everybody that value, that's fine if you're doing cross-city comparisons, but if you're working within a city, you clearly want to have a kind of measure that can be used at levels of geography that are subregions within a city.

Cont. Dr. Krieger: So, the value of the ICE that we've shown is we can even do multi-level models which we've done where you have census tracts nested within cities. We've done those across all of Massachusetts and we've shown that if you do models separately for census tract and then for city level, you will find that both have effects in terms of the socioeconomic gradients or racialized economic segregation gradients but if you do a multi-level model, you'll see often that a lot more is being explained with bigger gradients at the census tract level compared to the city/town level, not that the city-town level is irrelevant but actually you really want to be thinking about both.

So, we've used this now in our own research in something like over 15 studies both within cities, across states in different contexts. We've used it nationally with regard to county data and it's being picked up now by a lot of other researchers as of September because I was just doing a little lit review on it. There is something like nearly 25 other studies on a variety of different outcomes. It's been used for birth outcomes, mortality. It's been used for cancer, it's been used for pollution, and I think it starts to give a way of saying what I particularly like about it is it has both groups in the picture. So, when you look at just percent reports, there's nothing about who everybody else is and it doesn't tell you what's going on with people at the high end of the income distribution. Or if you say percent people of color, it doesn't tell you about what's going on with the other groups that are there.

This is something that's actually being able to capture the social relationship between groups that are defined in relation to each other, in relation to relations of power and privilege and so that, I think, is the utility and then also it's easily constructed out of just the census data. We have on our website for the Public Health Disparities geo coding project on the page that we've updated for COVID-19 resources, we've generated this ICE for racialized economic segregation for the entire U.S. for every county, every zip code, and every census tract so it's easy for people to go to if they want to search. They can just search on my name and see the resource for the geo coding project and it's right there.

So, I think that it's useful, it can be used across the county, it can be used within cities, and it starts to give a common metric that gets at the social relations that are key to understanding who and what drives health inequities in this country. Then the last thing I would say is that it's also been picked up by some of the health equity dashboards, like for example the city health dashboard which is supported by RWJF is now using it as one of its core measures.

De Maio: Surely that geographical flexibility that you described that it can be useful at hyper local levels where things like the Gini coefficient, arguably the most popular measure of income distribution, begins to break down and doesn't have the same validity as it does at larger levels of geography.

One kind of follow up question to the ICE index. Do you see it as a way of also incorporating history and context into cross sectional studies, so it gives us an avenue to explore how communities come to be the way they are?

Dr. Krieger: I mean, by itself it's a cross sectional measure. It's at a certain moment in time. You can construct and we have looked at, for example, census tract measures of the ICE over time but there you're bringing into time into the question. We've also looked at we have two studies that are now out looking at historical redlining and looking at them in relation to both cancer stage and diagnosis and also looking at preterm birth and you can look to see is that one of the mediating variables, but then again it's the original historical maps of the redlining produced in the 1930s that bring in the history. So what I would say is that this is an area-based indicator. It not something that shows what the rules of the game are. There are rules of the game behind it. If you look at Jim Crow, you have rules of the game right in your face, right, and I've done research that look at Jim Crow effects on contemporary health, where people were born, what age they were before 1965, what that means for adult health later.

There are rules of the games kind of measures. There measures that are implicit measures of the rules of the game but not explicit. So, for example, you look at what's going on right now around voter suppression. No one can use the terms race ethnicity for any of the strategies that are used because that is flagrantly illegal, so other things are done. So, you could look at rules of the game in terms of what kind of voter I.D. is required but that's not going to say that it's specifically about race even though it is structured about racial suppression of the vote. Then you have area-based indicators and you no longer see the agency and you don't see the history. You have to bring that to the story from the other reading and knowledge and experience that people have because that's not built into the measure, but that help frame the analysis, and again we have done studies which do use now the historical redlining or the Jim Crow date in addition to the contemporary data of conditions as measured by the ICE, but that you have to bring in because that's what your research framework allows because that's what your theory tells you to look for.

De Maio: Yeah, yeah. That idea of rules of the game I think is so insightful and, in many ways, reminds me of Paul Farmer and the idea of historically deep and geographically broad analysis to understand any contemporary poor health outcome.

Dr. Benjamins, I wanted to ask you about a project that you and I have been working on. It's been a great pleasure to work with you on this book project called "Unequal Cities," and one of the key metrics, one of the key data points in the book is the idea of excess deaths as a metric for understanding health inequities and stimulating action. Can you tell us a little bit about how you came to that metric and how it's been used before with the Sinai Urban Health Institute?

Dr. Benjamins: Sure. So, our book is called "Unequal Cities: Structural Racism and the Death Gap in America's 30 Largest Cities" and it's part of this larger initiative to look at Black and white disparities and mortality at the city level. Let me take a step back and tell you how we got there.

The impetus of this was our founding director, Dr. Steve Whitman, first noticed that Chicago women, Black women, were much more likely to die of breast cancer than white woman and he thought, "Is this the same across all the big cities," so he did a study and looked at that and found in fact it was not, that Chicago had one of the biggest inequities in breast cancer mortality and some cities didn't have any inequities. This was a really striking finding that really highlighted that race is a social construct and that racial inequities, they're avoidable. Some cities are making sure that women are dying at the same level of breast cancer, and that finding really was motivating. So in Chicago, for example, it motivated the formation of a task force that has pushed through some important policy changes and some quality improvement initiatives at healthcare systems around our city and that has led to the gap in Chicago shrinking, so now the disparities between Black and white women are smaller, so we saw the utility of this data and it really motivated us to look more comprehensively at mortality disparities.

So that's what we do. We look at everything from life expectancy to all the leading causes of death and we look specifically at racial inequities and as you said, one of the measures we look at is excess deaths and excess Black deaths are those deaths that occur because the Black mortality is higher than the white mortality rate so they're preventable deaths. We found in the U.S. 70 thousand excess Black deaths occur each year because the Black mortality rate's higher than the white mortality rate so a huge number.

If you look at it at the city level, our city, Chicago, has over 3,500 excess Black deaths each year and this number—we had done this earlier, about a decade ago, and found the number was 3,200. So, this number has actually gotten worse over time, but what we like about it is it's more accessible to different stakeholders. When we put that finding out ten years ago, a local newspaper, the Chicago Sun Times, put it in a headline. The numbers were this big across the page: 3,200 excess Black deaths. So it spoke to people in a way that the tables and tables and tables of all-cause mortality rates and rate ratios and confidence intervals that we include in the book just would not speak to policy makers so you have to translate that to figures or other ways to make it accessible.

Then the other thing we want to make sure to do every time that we're putting out numbers like this is to do what was said earlier, is to make sure that it's put in a context. So, it's very clear that it's not a race difference, it's a difference due to racism. In the book we talk about the history of racial disparities and national policies related to inequities. We talk about the theories including Nancy's theories, and then at the end we talk about what's the social justice framework for understanding these data and how do you create a community-engaged way to disseminate it? So, it's making sure the data's accessible and then making sure that it's understood in the context of health inequities.

De Maio: Thanks. And Dr. Sewell, a lot of this can be overwhelming. We face an onslaught of data of horrific indicators, and it's not just math, right? It's not just abstract numbers. These are people and families and communities with a great deal of preventable suffering. If we kind of take a step back to a broad of health equity research, what do you see as our collective strengths and weaknesses? What's most needed in this area of work? What would you like to see in the next ten, twenty years?

Dr. Sewell: I think the strengths is that our understanding of the analytical part of this is actually quite strong. I think we are building off of a legacy of research methodologists who've done a lot of work in pulling our people from place and so we're benefiting from those interventions. I also think, of course, we have our strength is that we have a sense of what should be the reality if everything was equal.

What I don't think we do very well is to understand and to create models of accountability. Our models are primarily focused on individuals who are sick. They use information maybe sometimes about reports of those individuals from other people. In our really cool case as we're talking about here, we have information about the other people around them. I don't know from those data who we should take to court, who's bank should we actually redistribute from I have no idea. I can't tell.

One of the things that has really guided my work is to really link the actions of people who control money, people who control the processes and rules by which everything that we understand comes into existence, living in a house to what actually happens to an individual. I'll give you a very small story, but it's actually a very long story. It's the story of my entire life. I graduated right around 9/11. It happened the year I graduated. So, the folks here, they came out to COVID. I came out to 9/11. We're a group of people, I would make the argument, that are actually part of creating the social movement that we see today.

It was a year before I graduated and a PhD student said, "Hey, can you come with me? Would you take videos of me?" And all they wanted me to do was go down to the car, put the video and then see what was on the block. Well, this is what we now know as systematic social observation. It was one of the most ... the Project on Human Development in Chicago Neighborhoods was one of the most expensive studies that was funded by National Institutes of Justice and what I found, I have a paper that was recently accepted for publication in a methods journal, Sociological Methods & Research, and it talks about how we can actually grow asthma in children in Chicago. What we find is that if you live in a neighborhood where mortgage companies are less likely to give minorities access to mortgages, so these people get the mortgages, but these mortgages have pre-payment penalties, they're very expensive. When there's a default they take the house very quickly and these are essentially it's called contemporary redlining. They are also the same neighborhoods that are linked into the foreclosure crisis in the great recession.

These are also the same neighborhoods, and this arguments is the same neighborhoods that birthed the children of the Black Lives Matter movement and we grow asthma in these kids who grow up in these neighborhoods. I found that in Chicago. If you take that same group of people, these individuals came out to Amadou Diallo. 1999, 41 shots in New York City. The civil rights case, the New York City stop, question, and frisk database was used in order to make the case that stop, question, and frisk in New York City was illegal. So in the information on ... that's redlining. Doesn't seem like it's anywhere near connected in Chicago. In New York City, same period of time, we have development of a case against the political system that used the same types of data, National Institutes of Justice data crime data, to say, "These kids, they need to be put in jail."

Well, using that data they were actually able to say that in fact when police look at people, Black and brown people, the way they're discriminating is not by looking at the person. It's by going to their neighborhoods. Well, the information that I've been looking at with policing, it takes that same data, that same period of data that was used to make the case that stop, question, and frisk was unconstitutional. It says that same data, we can look at inequities in frisking, use of force, racial differences, gender differences and these types of things and we can look at, unfortunately, the same things that are linked to COVID deaths right now. High blood pressure, diabetes, obesity. It's really, really sobering.

Cont. Dr. Sewell: When people see all of that, they just see people dying. They see people being sick. I see the actions of the predatory lending market where there was a housing boom creating the condition of disparities in which these same kids who came out during the tech boom, and matter of fact, the world was ending in 2000. There was no world. They came out into the world that wasn't supposed to exist and then they went through a recession, right, and then they went through a protest and now we have 2020, people in the streets, all over the world, saying, "Wait a minute. This is not right." People don't see those things as connected. All I'm doing with my data is connecting institutional actors in mortgages, in housing, how people get to those desegregated places, to the institution of the gatekeepers that say, "Hey, wait a minute. You don't need to be in this place. You need to be going to jail," to now that we are holding our policy makers accountable for that entire range.

I'm not going to lie. I have not quite put the pieces of the picture together in one data set, but the pathways are there. The work that Nancy's doing, the work that Maureen is doing, the work that people are doing on police violence and segregation, the data is there. The question is can we put it together in a way that can tell a story of how we get to justice, and this is my last point. There's a data set that has been in the field for about four years now. It was done in the Collaborative Multi-Ethnic Political Survey. That data has a question that's been fielded by activists in 2010 which was, "If you see the police engaged in excessive use of force, do you report them?" They also asked, "Have you been detained, arrested," all this other stuff.

What we know from this data is that if someone both has contact with the police and records the police, this is bad for your health. But if they do both, right, if they have contact and they record, this is actually good for their health. The reason why this is really important is that when you look at the people who press record, they're the most disadvantageous, the most disenfranchised, the most marginalized people. They are Black, brown immigrants. They are queer people. They are people without education, without income, without wealth. They don't have valid I.D.s. They're not registered to vote. I could go on and on and what we know is that those disenfranchised people are the ones whose video ... they're the lives you're seeing on the camera right now and they're essentially asking us to go vote for them. They're asking us to put them back into the political process and they're saying that not only if we do this one act of revolution, so to speak, we'll save our lives, but we may save your life as well.

De Maio: I can't thank you enough for this conversation. The data and data analysis isn't just about math. It's not just about numbers, right? It's about people, it's about communities, it's about the lived experience, about history and politics and economics that get passed down through generations and all of you in your work are, I think, honoring that. Giving voice to communities, recognizing the deep structural drivers of health inequities and little by little how data can I think really change the world for the better.

So again, I thank you all for the conversation today and I can't wait to see your next work. Thank you.

Dr. Benjamins: Thanks for having us.

Dr. Sewell: All right.

Dr. Krieger: Thank you.


Disclaimer: The viewpoints expressed in this video are those of the participants and/or do not necessarily reflect the views and policies of the AMA.

Table of Contents

  1. Panel
  2. Transcript

FEATURED STORIES